Data Management: The Complete Guide to the Microsoft Ecosystem
Data management: how to structure, govern, and secure your data with Microsoft Purview, Azure, and Dataverse. Expert guide.
Anxious to succeed in the digital transformation of your company, you have invested in Power BI, launched a few analytics projects, and attended conferences on “data culture”. However, a few months later, your expectations are disappointed because your teams continue to make important decisions “by feeling”, your data remains scattered in a dozen unconnected tools and your carefully designed dashboards are gathering dust.
Today, it is no exaggeration to say that the model Data-driven is now the ultimate in modern organizations. That said, there is a chasm between the enthusiasm to begin the transformation and the challenges of operational reality. In what follows, we will demystify this move to action by asking ourselves why so many initiatives fail, what are the three inseparable pillars of a successful transformation, and above all, what concrete methodology to adopt to transform your data ambition into operational reality with the Microsoft ecosystem.

A data-driven organization is a business where data systematically guides decisions, whether strategic or operational. It's not just “having data” or “reporting” — it's creating an environment where every employee has easy access to the information they need to make the best possible decisions.
This results in:
For example, instead of examining its results via reports that are barely produced that they are already obsolete, a data-driven sales team drives its daily actions via real-time dashboards in Dynamics 365 Sales. Thanks to effective data visualization, salespeople immediately see what needs their attention.
Beyond this operational agility, the measurable benefits of the data-driven model are multiple:
Organizations that successfully transform see significant improvements. However, the majority fail before reaching these results.
Because data-driven transformation is the victim of several unfortunate misunderstandings.
Too technological approach is the number one trap. We buy Power BI, we deploy Azure, we train a few analysts and we wait for the magic to happen but the magic does not work because the dashboards created do not meet the real business needs of daily life and in the field.
Then there are the poor quality or siloed data. If your customer data is scattered between your CRM, your ERP, your marketing tools and a few Excel files, you will never have a unified vision. However, without a unified vision, it is impossible to make coherent decisions.
In addition to this the lack of data skills in business teams, which creates a gap between those who produce the analyses and those who should use them. Same thing for the cultural resistance (“we've always done it this way”) coming from a fear of losing one's decision-making power or expertise.
Even more pernicious, thelack of clear governance quickly turns your data infrastructure into an uncontrollable jungle: who owns what data, who can access it, what is the source of truth? Without a clear answer to these questions, decision-making is paralyzed.
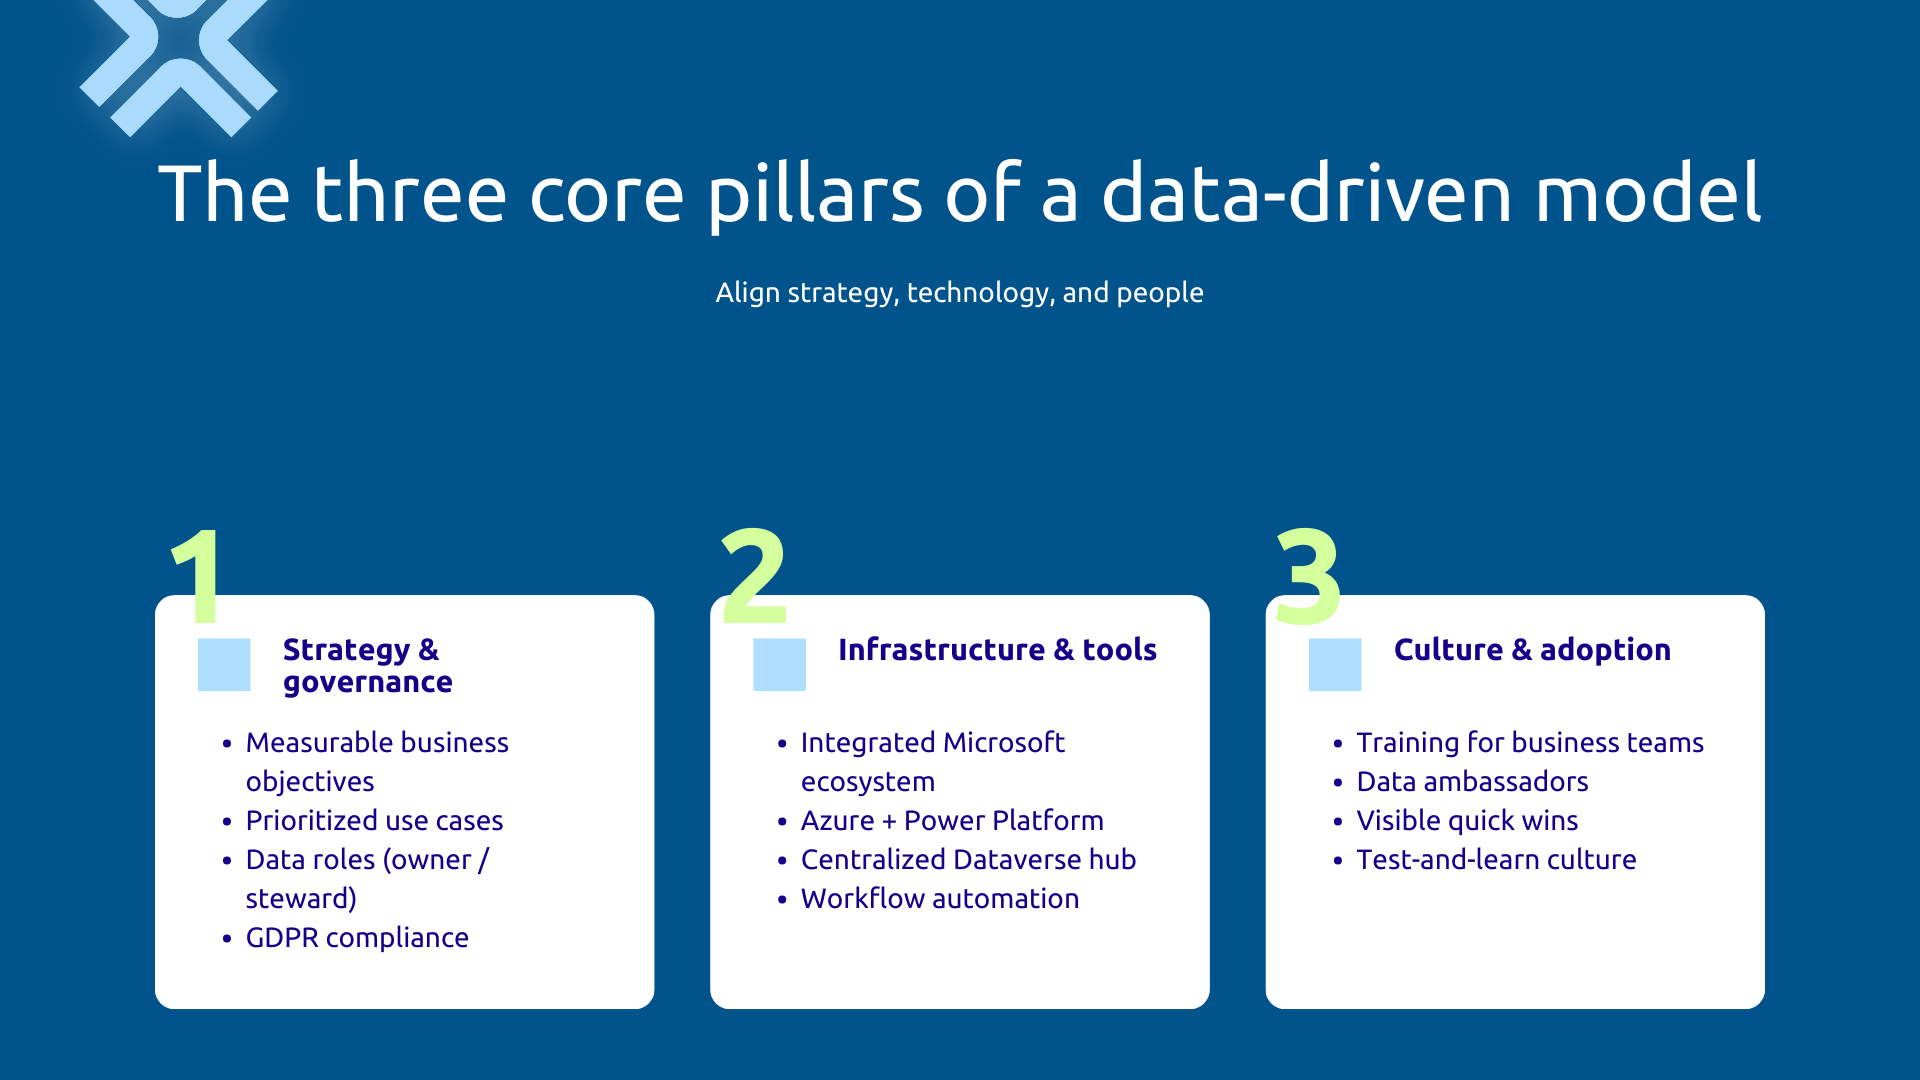
Here, the definition of business objectives guided by data is your starting point — not technological goals (“deploying Power BI”), but measurable business goals: “reducing lead qualification time by 30%”.
In a second step, we will have to identify the high added value use cases in order to prioritize intelligently. Not all data projects are created equal, so focus on initiatives that provide the most business value with the least technical complexity.
In parallel, proceed with the implementation of a data governance framework. In concrete terms, this means defining key roles: the data owner bears business responsibility for a data domain, the data steward guarantees its quality on a daily basis and access rules protect sensitive information. This data management will cover the entire data life cycle.
For example, for a scoping workshop with a sales department, you jointly identify three priority use cases (automatic lead scoring, sales forecasts, conversion rate analysis) that become your roadmap for the first six months.
The Microsoft ecosystem offers a complete and integrated stack to become data-driven.
It all starts with the collection and integration where you connect your data sources (Dynamics 365, business applications, external systems) through Power Platform and Azure. The latter facilitates this integration thanks to its hundreds of native connectors that automatically feed your platform, thus eliminating time-consuming and error-prone manual extractions.
Once the data is collected, the storage and modeling take over. Azure Data Lake hosts big raw data, Azure SQL Database structures critical data, and Dataverse serves as a centralized hub for business data.
This modern data architecture combines the data lake that stores everything in its raw format, the data warehouse that structures and aggregates for analysis, and data marts that provide optimized business views.
On these foundations, the analysis and intelligence transform your data into insights. Power BI makes visualization accessible to all employees, Azure Synapse Analytics processes Big Data, and AI Builder integrates generative AI and predictive AI without requiring data science expertise.
Finally, the activation Close the virtuous loop. Power Automate automates data-based workflows, while Dynamics 365 orchestrates business processes enriched by data intelligence. Thus, the recommendations resulting from your analyses become concrete actions in the daily tools of your teams.
First of all, train your business teams on the essentials: interpreting an indicator, identifying biases, questioning a correlation that is too good. Short and practical sessions, adapted to each level, are much more effective than generic technical training.
At the same time, nominate data ambassadors in each team to accelerate adoption. These business champions — not data scientists — understand the value of data and support their colleagues on a daily basis to remove bottlenecks.
This dynamic requires a transparent communication : why are we changing? What does that mean for me in concrete terms? Without clear answers, you fuel the fears that torpedo adoption.
Beyond the speeches, quickly demonstrate value via visible results. When a salesperson sees that a tool really helps them close more deals, they become your best prescriber — no corporate communication is worth this authentic testimony.
Finally, promote a test & learn culture that turns mistakes into learning. Data becomes a tool for experimentation: we test, we measure, we adjust. This scientific approach to business decisions is at the very heart of the data-driven model.
A data maturity audit is your mandatory starting point to understand where you are before defining where you want to go.
Start with map your existing data sources, which often reveals surprises: how many systems host customer data in your organization? This fragmentation will be your first problem to solve.
Also assess the quality of your data. Are they complete, accurate, and consistent across systems? Do you have duplicates? Empty critical fields? Incompatible formats? These observations are painful but essential.
Beyond the technical aspects, analyze your current decision-making processes to identify opportunities. How are important decisions made today? On what information? With what time frame? What decisions could be improved by better access to data?
Also consider identify available skills in your teams to adjust your training plan. Who already masters analytics tools? Who could become a data ambassador? What are the critical skills gaps that need to be filled?
Finally, Measure your data maturity level to position yourself on a scale ranging from the initial stage (silo data) to the optimized stage (centralized infrastructure with mature governance). From there, you can build a realistic action plan.
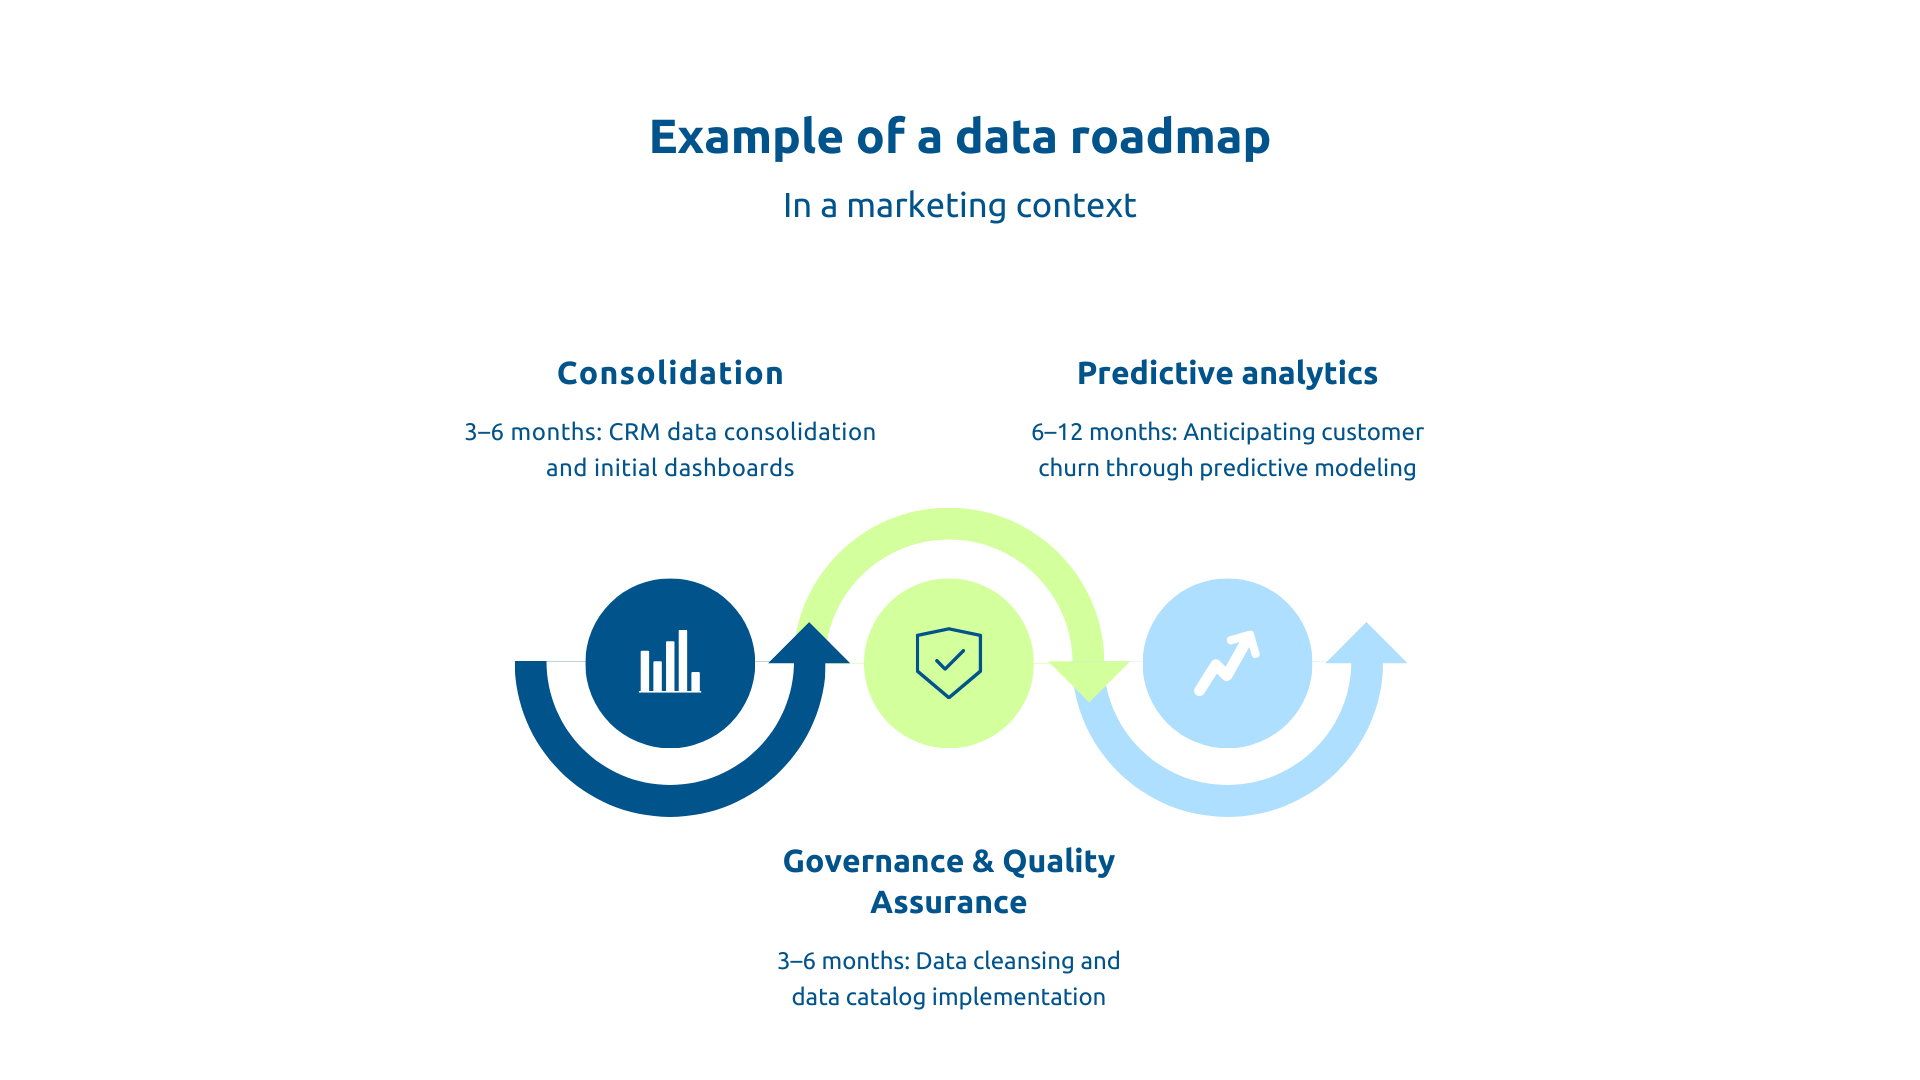
First of all, prioritize your use cases via a value/complexity matrix to identify the initiatives that provide the most business value with the least technical complexity. These rapid results over 3-6 months create positive momentum and get skeptical teams on board — nothing beats concrete successes to convince the last reticents.
And then, plan your medium-term projects over 6-18 months to structure your transformation. After laying the foundations and validating the initial successes, you can deploy more ambitious initiatives. Even as you move forward in stages, remember to maintain a long-term vision that guides your architecture and investment choices.
Of course size your budget and resources in a realistic way. Data-driven transformation requires investments in licensing, infrastructure, training and support — underestimating these needs guarantees failure.
In mirror, define success KPIs by step to objectively measure your progress. Choose measurable business KPIs (“reduction in lead processing time”) rather than technical ones (“number of dashboards created”).
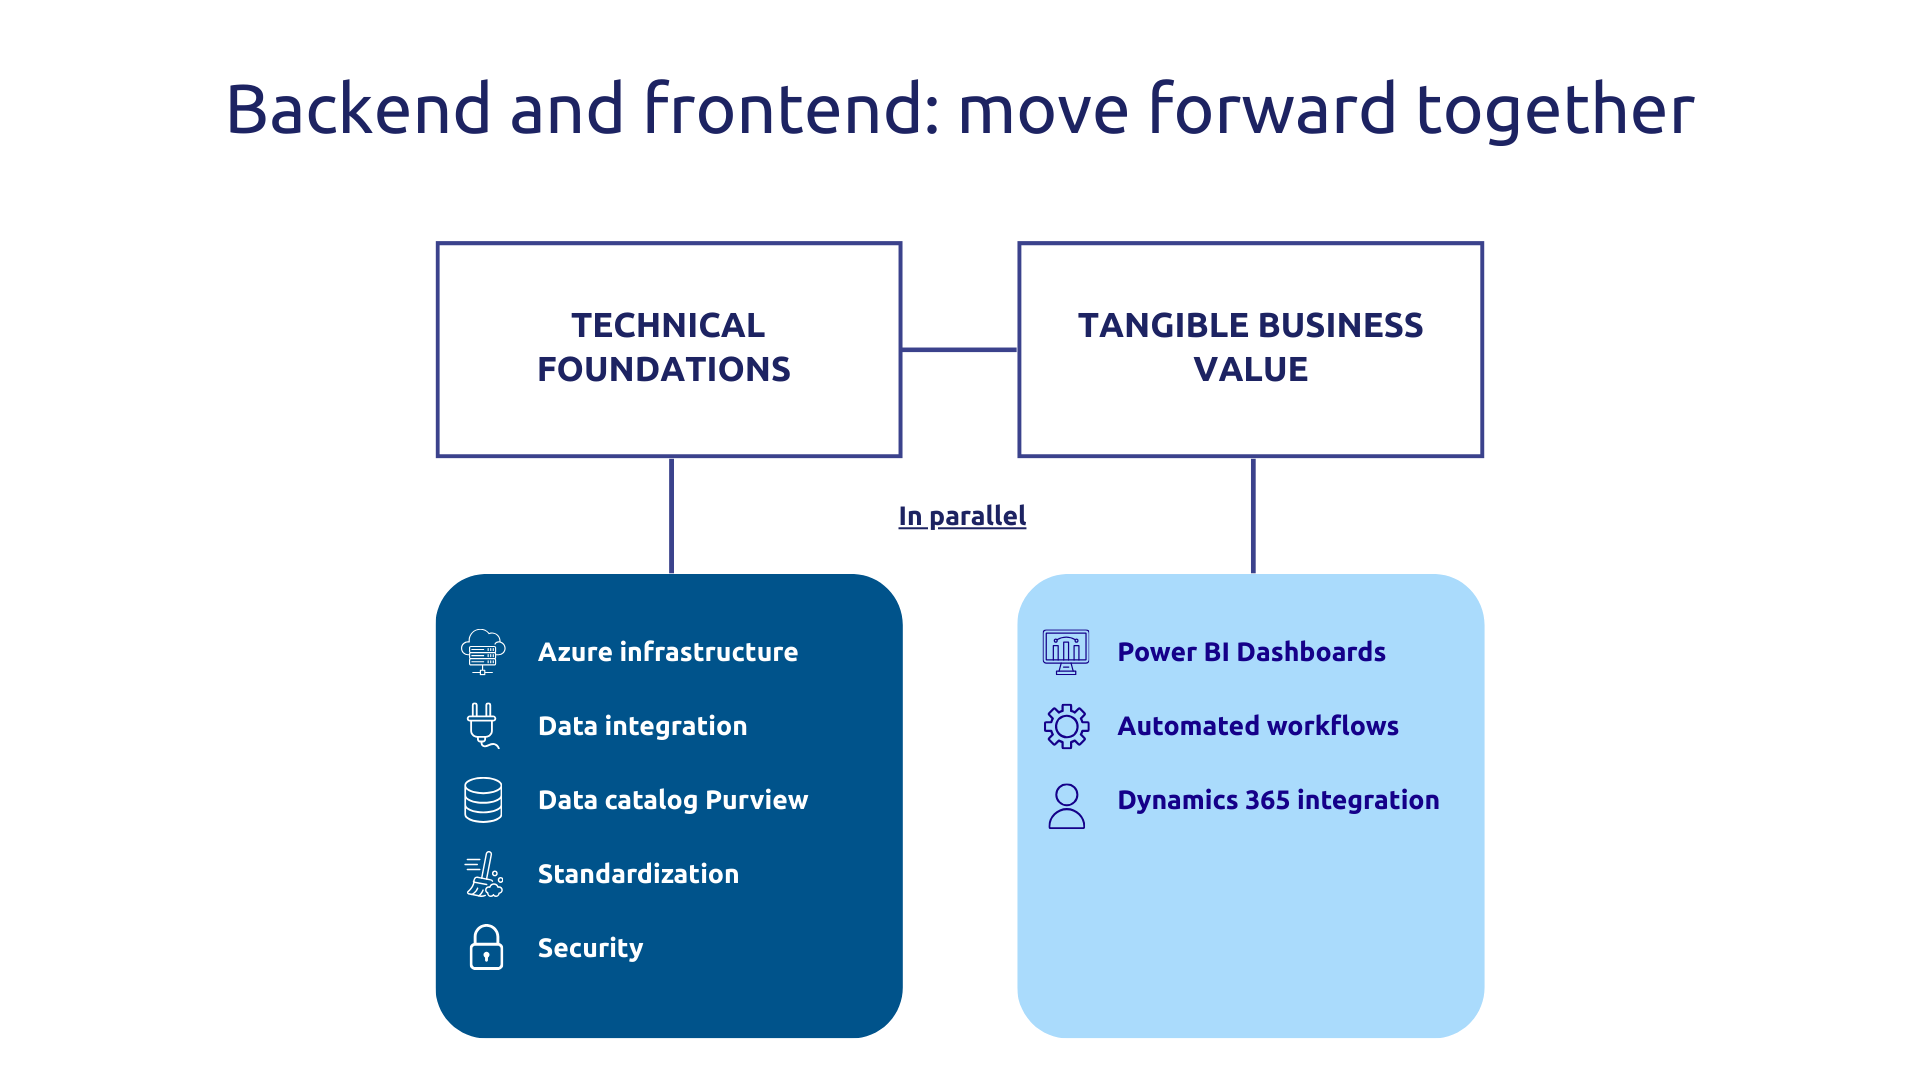
Deploy your infrastructure by provisioning the required resources on Azure and integrating your data sources through connectors, APIs, and ETL pipelines that automatically transform and route data to your central platform.
At the same time, set up your data catalog with Azure Purview to create your central repository where each data is documented: where does it come from, who is responsible for it, who can access it, what is its business definition. This traceability is crucial for governance.
In addition, clean and standardize your data via rules that are systematically applied during ingestion. Finally, secure your access with security by design via Azure AD and RBAC according to the principle of least privilege.
While these foundations are being built, you are already creating visible value. Develop Power BI dashboards tailored to each role and decision-making need — not generic reports that no one will see. Automate your processes to turn insights into actions: when an indicator exceeds a critical threshold, a workflow is triggered. Finally, integrate into Dynamics 365 to close the loop: salespeople see the recommendations resulting from the analysis directly in their CRM, without navigating between several tools.
As a first step, train your end users on how to manipulate dashboards, interpret indicators, identify weak signals. In addition, train your power users to create additional autonomy: these business employees learn to create their own simple reports, reducing their dependence on IT.
To maintain this dynamic, create an internal data community of practice where good practices spread naturally. Celebrate successes to reinforce the legitimacy of transformation: when a department significantly improves its results with data, communicate it widely to inspire others.
But adoption is just the beginning, because becoming data-driven is an ongoing journey. Monitor usage and value generated to find out what really works: what dashboards are consulted, what analyses influence decisions. Based on this, optimize performance and costs by identifying slow queries and underutilized resources.
Over time, gradually extend the Culture data : The organization that starts with sales extends to marketing, then to customer service, then to operations. Each division benefits from previous apprenticeships.
Only when you have achieved all of this, integrate advanced capabilities (sophisticated predictive AI, real-time processing) to evolve your maturity and open up new horizons of performance.
Marketing and sales are often the first functions to benefit from a data-driven approach because each action generates measurable data with a direct impact on revenue.
The automatic lead scoring focuses commercial efforts on the most promising opportunities. In addition, multi-channel marketing attribution precisely measures the contribution of each touchpoint to optimize investments. Beyond acquisition, predicting customer churn makes it possible to act before departure by identifying weak signals. On the commercial level, sales forecasts via a powerful CRM provide visibility to adjust the strategy in real time and anticipate resource needs.
The finance function is evolving radically, moving from a reporting role to a role of forecasting.
Dynamic financial forecasts based on real-time data replace static budgets and are updated automatically. At the same time, automatic anomaly detection alerts immediately to significant discrepancies to allow rapid reaction. This predictive ability also feeds optimizing cash flow and working capital, which accurately anticipates needs and reduces fixed capital. Complementing this system, the granular profitability analysis reveals the real margins per customer, product or project taking into account all costs.
Operations are a breeding ground for data-driven because each process generates usable data.
Inventory optimization is based on demand prediction that turns planning into a dynamic process based on historical patterns and external signals. At the operational level, predictive maintenance avoids costly breakdowns by triggering interventions just in time thanks to sensors that monitor the condition of the equipment. Finally, logistics optimization calculates the optimal routes in real time according to traffic and customer priorities.
Askware accompanies you to transform your data-driven ambition into operational reality, by orchestrating all the components of your transformation on the Microsoft ecosystem. From initial audit to continuous optimization, we combine advanced technical expertise and a deep understanding of business challenges to build an organization where data really guides action.
Ready to move from speech to action? Contact our experts to define your data-driven strategy and find out how to turn your data into real competitive advantage.
Being data-driven requires an integrated ecosystem rather than a single tool. In the Microsoft universe, this combines Power BI for analytics, Dynamics 365 for centralizing business data, Azure for infrastructure, Power Automate for automating workflows, and Dataverse as a centralized hub. The classic mistake is buying these tools and waiting for the magic to happen — without a clear strategy, solid governance, and team support, even the best tools will remain under-exploited.
Data governance organizes how your business collects, stores, uses, and protects data. It answers crucial questions: who is responsible for this data, who can access it, what is the official definition of a “qualified lead” throughout the organization. Without governance, you end up with a jungle of contradictory data where no one knows which version is the right one.
Data maturity is assessed on: strategy and governance, infrastructure and tools, skills and culture. Frameworks position your organization on a scale ranging from the initial siloed stage to the optimized, integrated and automated stage. The point is to identify your strengths and weaknesses in order to build a realistic and progressive action plan.
Our experts share their vision of best practices and technological trends to ensure the success of your digital transformation.