Power BI: the Business Intelligence tool accessible to everyone
What is Power BI and what is it for?
Power BI is Microsoft's data analysis tool that turns your scattered data into actionable visualizations and insights. Its role is threefold:
- Connect different data sources,
- Create interactive dashboards,
- Sharing analyses to facilitate decision making.
The real revolution lies in the concept of Self-service BI : you no longer need to be a data analyst to create your own analyses. Sales managers, CFOs, HR managers and operational managers can manage their business with consolidated and up-to-date data, without always depending on the IT team.
In concrete terms, you can connect more than 200 data sources to Power BI (such as Excel, SQL Server, Excel, SQL Server, Dynamics 365 Sales, Salesforce, Google Analytics, Dynamics 365 Business Central), transform and clean your data automatically, create powerful visualizations, and share your dashboards on web, mobile or Teams.
The difference with Excel is fundamental. Where Excel gives you a static snapshot that becomes obsolete as soon as it's created, Power BI connects directly to your sources, refreshes data automatically, and allows data to be visualized in an interactive dashboard. No more manual copy and paste, no more multiple versions circulating by email. Your dashboards are always up to date and shared securely.
Power BI Desktop, Power BI Service, Power BI Mobile: Understanding the Ecosystem
Power BI consists of three complementary components:
- Power BI Desktop is the free Windows application for creating Power BI reports and dashboards.
- Power BI Service is the cloud platform where you publish, share, and view your reports with automatic data updates.
- Power BI Mobile allows you to consult your dashboards while on the go and receive alerts on the KPIs of your dashboards.
Concretely, you create the dashboard in Power BI Desktop by connecting the data sources, modeling them, and creating the data visualization rules and you publish in Service by defining the access rights rules. On a daily basis, you consult your automated reporting in Service or Mobile.
Power BI vs other BI tools (Tableau, Qlik): what positioning?
Power BI stands out for its native integration with the Microsoft ecosystem (Office 365, Teams, Dynamics 365, Azure), accessible pricing (free Desktop version, competitive Pro licenses) and its smooth learning curve for users who are used to Microsoft tools.
Continuous innovation regularly integrates new functionalities, including AI with Copilot, which generates insights in natural language. For the majority of organizations operating in the Microsoft ecosystem, Power BI combines accessibility, power, and deep integration with your existing tools.
Alternatives like Tableau or Qlik can be interesting when you have very specific or very advanced data visualization needs and your organization does not use Microsoft tools.
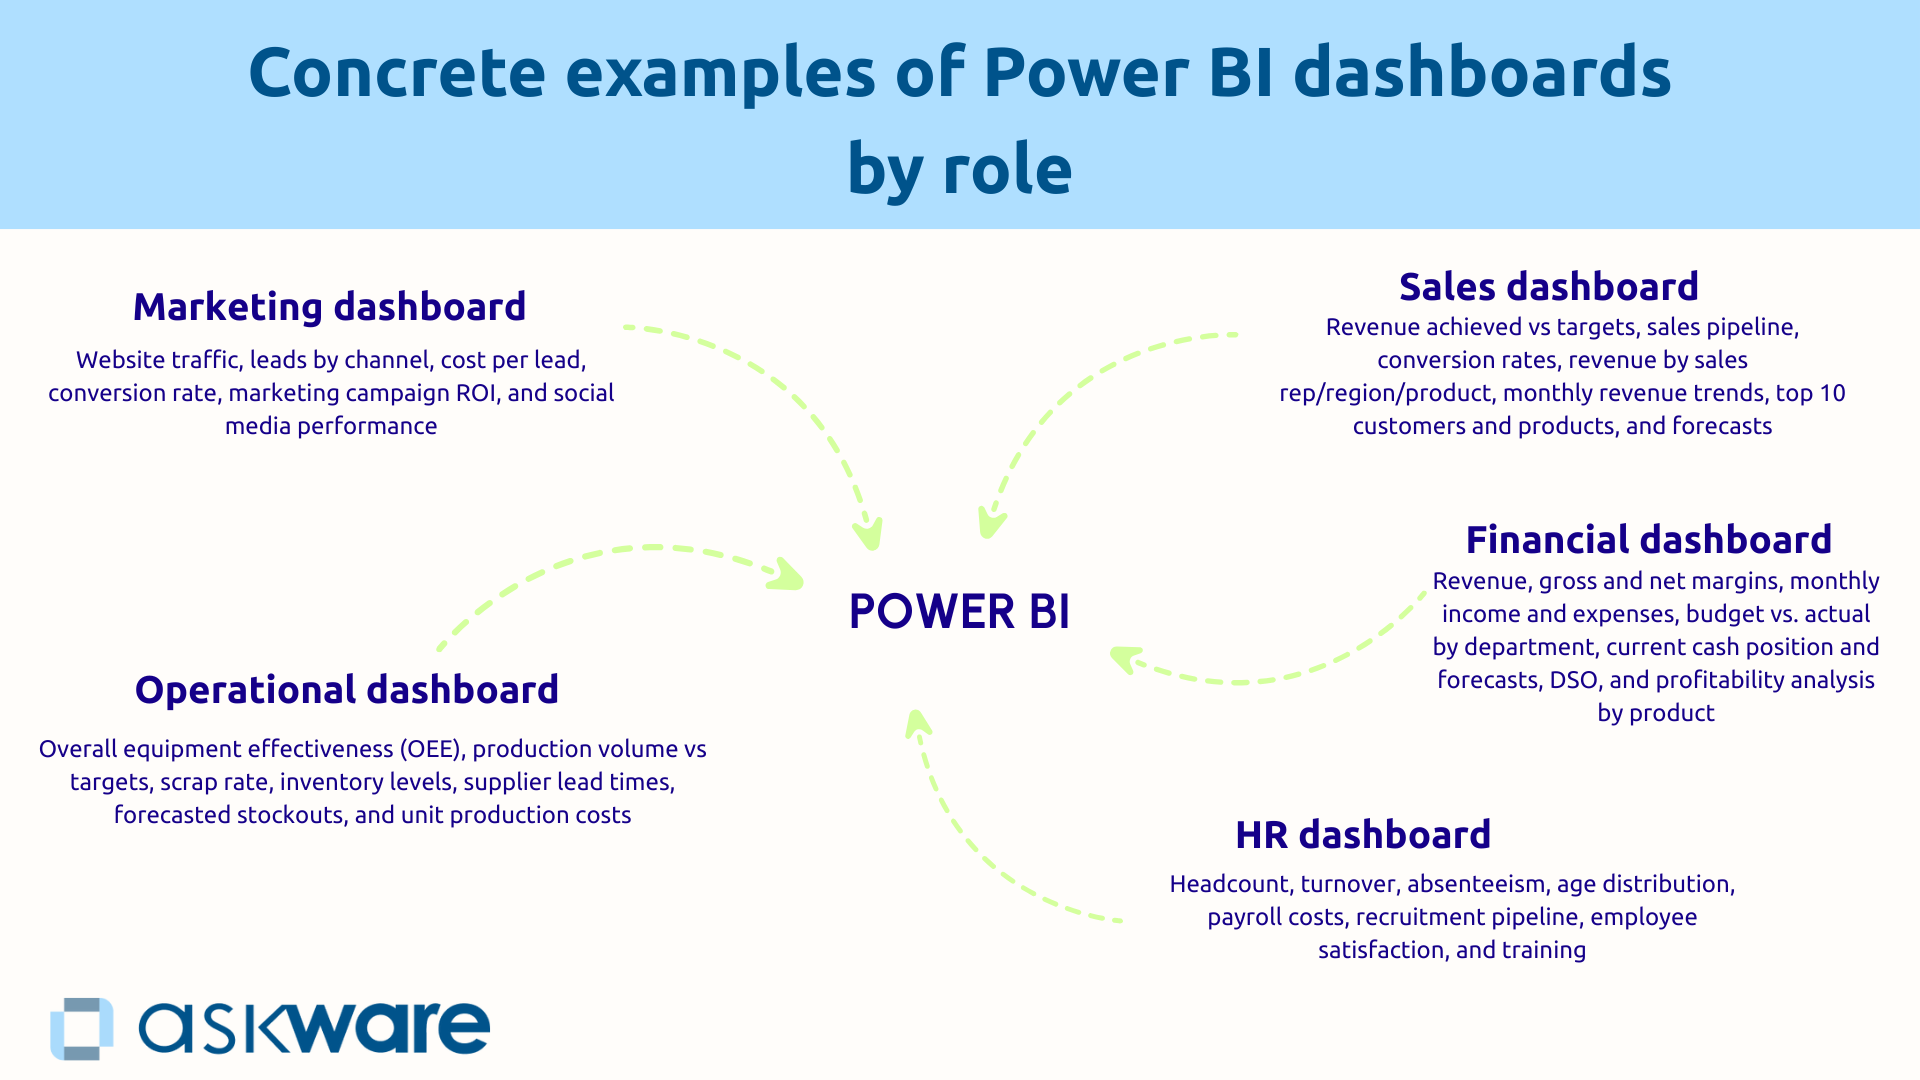
Concrete examples of Power BI dashboards by business line
Power BI is useful in the various business areas of the company to manage performance. Power BI can be used for example at the level of sales, financial, HR, operational or marketing management.
Sales dashboard: managing sales and commercial performance
The commercial directions use Power BI to get a consolidated real-time vision of their activity.
One Commercial dashboard poster type:
- The turnover achieved versus the objective over a specific period of time (month, quarter, year),
- The commercial pipeline to see current opportunities by phase,
- The rates of conversion of leads into opportunities and then into sales,
- Sales by commercial/region/product,
- The monthly evolution of turnover with a trend curve,
- The top 10 customers and products,
- Forecasts based on the pipeline.
This table connects to Dynamics 365 Sales or your CRM for opportunities, to your ERP for billed revenue, and to Excel for goals.
Management is proactive and the insights are immediate: you identify underperforming salespeople to plan coaching, you detect regions that are lagging behind in order to allocate sales reinforcements, you anticipate the achievement of your quarterly goals several weeks in advance.
Financial dashboard: monitor profitability and cash flow
CFOs rely on Power BI for a predictive financial management.
One financial dashboard includes:
- Sales, gross and net margins,
- Monthly income and expenses compared to the budget,
- The budget versus the actual per department,
- Current cash flow and forecasts,
- The DSO (customer payment term),
- Profitability analysis by product.
This data comes from Dynamics 365 Business Central, Excel files for budgets, and bank statements.
Thanks to Power BI, you can quickly identify budget overruns to trigger corrective actions, anticipate cash flow pressures to negotiate credit, and discover products that degrade your margin.
HR dashboard: monitoring headcount and social performance
HR directors use Power BI for a proactive social management that supports the company's strategy.
One HR dashboard presents:
- Staff by department with an indication of their employment contract (CDI, CDD, interim),
- Turnover to monitor the departure of employees,
- Absenteeism,
- The age pyramid,
- The payroll,
- The recruitment pipeline,
- Employee satisfaction,
- The training courses followed.
Preventive actions are becoming possible: a high turnover in a department triggers an investigation and loyalty actions, an unbalanced pyramid alerts to the need to anticipate recruitments, an under-consumed training budget encourages managers to be relaunched.
Operational dashboard: monitoring production and supply chain
Operations managers use Power BI for a real-time management of industrial performance.
A dashboard shows:
- The overall rate of return (TRG/OEE),
- The volume of production versus the objective,
- The scrap rate,
- Inventory levels on raw materials and finished products,
- The delivery times of suppliers,
- The foreseeable breakdowns,
- Unit production costs.
Connected to your ERP and IoT sensors, this table makes it possible to detect a decrease in efficiency to plan preventive maintenance, to anticipate stock shortages and to identify abnormal costs.
Marketing dashboard: measuring the ROI of campaigns
Marketing managers measure the performance of their investments with a consolidated dashboard:
- Website traffic (number of visitors, page views, bounce rate),
- Leads by channel (SEO, SEA, social networks, email),
- The cost per lead per channel,
- The rate of conversion of leads into opportunities,
- The ROI of marketing campaigns (reach and commitment),
- The performance of social networks.
This data comes from Google Analytics, LinkedIn Ads, and Dynamics 365 Customer Insight. You identify profitable channels to reallocate your budget, detect underperforming campaigns, and optimize the conversion journey.
How does Power BI turn your data into actionable insights?
Connect all your data sources in one click
Power BI eliminates data scatter with more than 200 native connectors to Microsoft and third party systems. Two connection methods are available to you:
- DirectQuery queries your databases in real time. This is a direct connection that is particularly useful for large databases.
- Import is a local copy of the data with a scheduled refresh according to the desired frequency.
Multi-source consolidation allows you to create relationships between different sources. For example, you can simultaneously connect Dynamics 365 Sales, Business Central, and Excel and link them together using common keys to get a unified view. No more manual exports and multiple Excel versions.
Transform and model your data with Power Query
Power Query allows data to be prepared. It automatically cleans and transforms them by removing duplicates, correcting errors, harmonizing formats, merging columns, creating calculations.
The visual interface makes these operations accessible by a simple click, without code.
All your stages are recorded and replayable automatically at each update, saving you hours of manual preparation. The data is usable.
Create compelling, interactive visualizations
Power BI offers a wide variety of visuals to visualize your data:
- Classic charts (curves, sectors, bars...),
- Geographical maps,
- Gauges and KPIs,
- Tables and matrices,
- Funnels and funnels,
- Advanced graphics (such as waterfalls or treemaps),
- Personalized visuals.
Interactivity transform the experience: click on a region and all visuals are automatically filtered. The Drill-down allows you to zoom from general to detail so you can visualize the annual turnover and then the details by customer in a few clicks.
Slicers (visual filters) personalize the view according to the needs of each person. It is also possible to configure Tooltips that allow you to have additional information when you hover over the data.
However, be careful, too much data kills the data. Focus on clarity with 5 to 8 essential KPIs rather than an overloaded dashboard.
Use DAX for advanced calculations (without being a developer)
DAX (Data Analysis Expressions) is Power BI's formula language, comparable to Excel but more powerful. DAX can be used to:
- Temporal calculations (accumulations, N-1 comparisons, moving averages),
- Growth rates and changes,
- Contextual calculations.
For more than half of the needs, simple formulas are sufficient. And now, Copilot generates DAX formulas from a natural language description, democratizing access to sophisticated analyses.
.png)
The concrete benefits of Power BI for organizations
Decision making based on reliable and up-to-date data
Power BI is transforming decision making from “responsive and intuitive” to “proactive and data-driven”. With consolidated data from a single source of truth and automatic updates, your decisions are based on reliable and recent facts.
The complete visibility on all dimensions (time, geography, products) allows analysis from all angles. Anticipation becomes possible. For example, a CEO will be able to detect via his dashboard that product sales have been falling for two months and will immediately launch corrective actions, instead of waiting for the quarterly report.
According to the McKinsey Global Institute, poor data quality impacts business performance with a drop in productivity of 20% and an increase in operational costs of 30% on average.
Massive time savings on reporting
Before Power BI, your teams spent hours (or even days) every month at Compile manually data. With Power BI, the update is automatic, dashboards are always up to date and accessible and copy and paste errors disappear.
For example, a management controller can replace the 3 days per month he spent compiling financial reports with time for analysis and strategic recommendations because Power BI will have updated everything automatically.
This time saving is multiplying throughout the organization.
Democratization of data and autonomy of businesses
The Self-service BI allows each business to create its analyses without depending on IT. Secure sharing with rights management ensures that everyone has access to relevant information. This democratization favors a Data-driven culture in the organization.
Thus, the marketing department can create its campaign performance dashboard, update it daily and improve it according to its needs. The marketing department is autonomous and responsive without depending on IT.
.png)
Power BI makes Business Intelligence accessible to any manager who wants to manage with reliable and up-to-date data. Whether you're looking to track your sales, manage your profitability, measure your HR performance, or optimize your operations, Power BI connects all your sources, creates interactive dashboards, and provides access to insights to make better decisions.
Thousands of organizations have made the switch from Excel to Power BI, freeing up days of manual reporting to focus on analysis and action. The transformation is accessible, gradual and generates a rapid return on investment.
Succeeding requires identifying your management needs, to start with a priority use case and to train or receive support. Askware supports you at every stage: identifying your KPIs, creating your dashboards, training your teams, connecting with your Dynamics 365 and Power Platform ecosystem, and setting up a Power BI center of excellence.