Azure Monitor: the Microsoft observability platform
What is Azure Monitor?
Azure Monitor is Microsoft's monitoring and observability service that collects, analyzes, and acts on telemetry data generated by your cloud resources.
Imagine it like an airplane dashboard: it displays all critical indicators in real time and alerts the pilot as soon as an anomaly occurs.
Concretely, Azure Monitor collects metrics and logs from all your Microsoft resources:
- Azure infrastructure,
- Applications via Application Insights,
- The Dynamics 365 environment via Dataverse logs,
- The Power Platform via the administration API,
- Microsoft 365 thanks to the connectors.
It analyzes this data using the KQL query language (Kusto Query Language), visualizes it via customizable dashboards and automatically alerts in case of anomaly with configurable actions.
This unified approach makes Azure Monitor your single control tower for monitoring your entire Microsoft ecosystem, where you previously had to juggle multiple disparate tools.
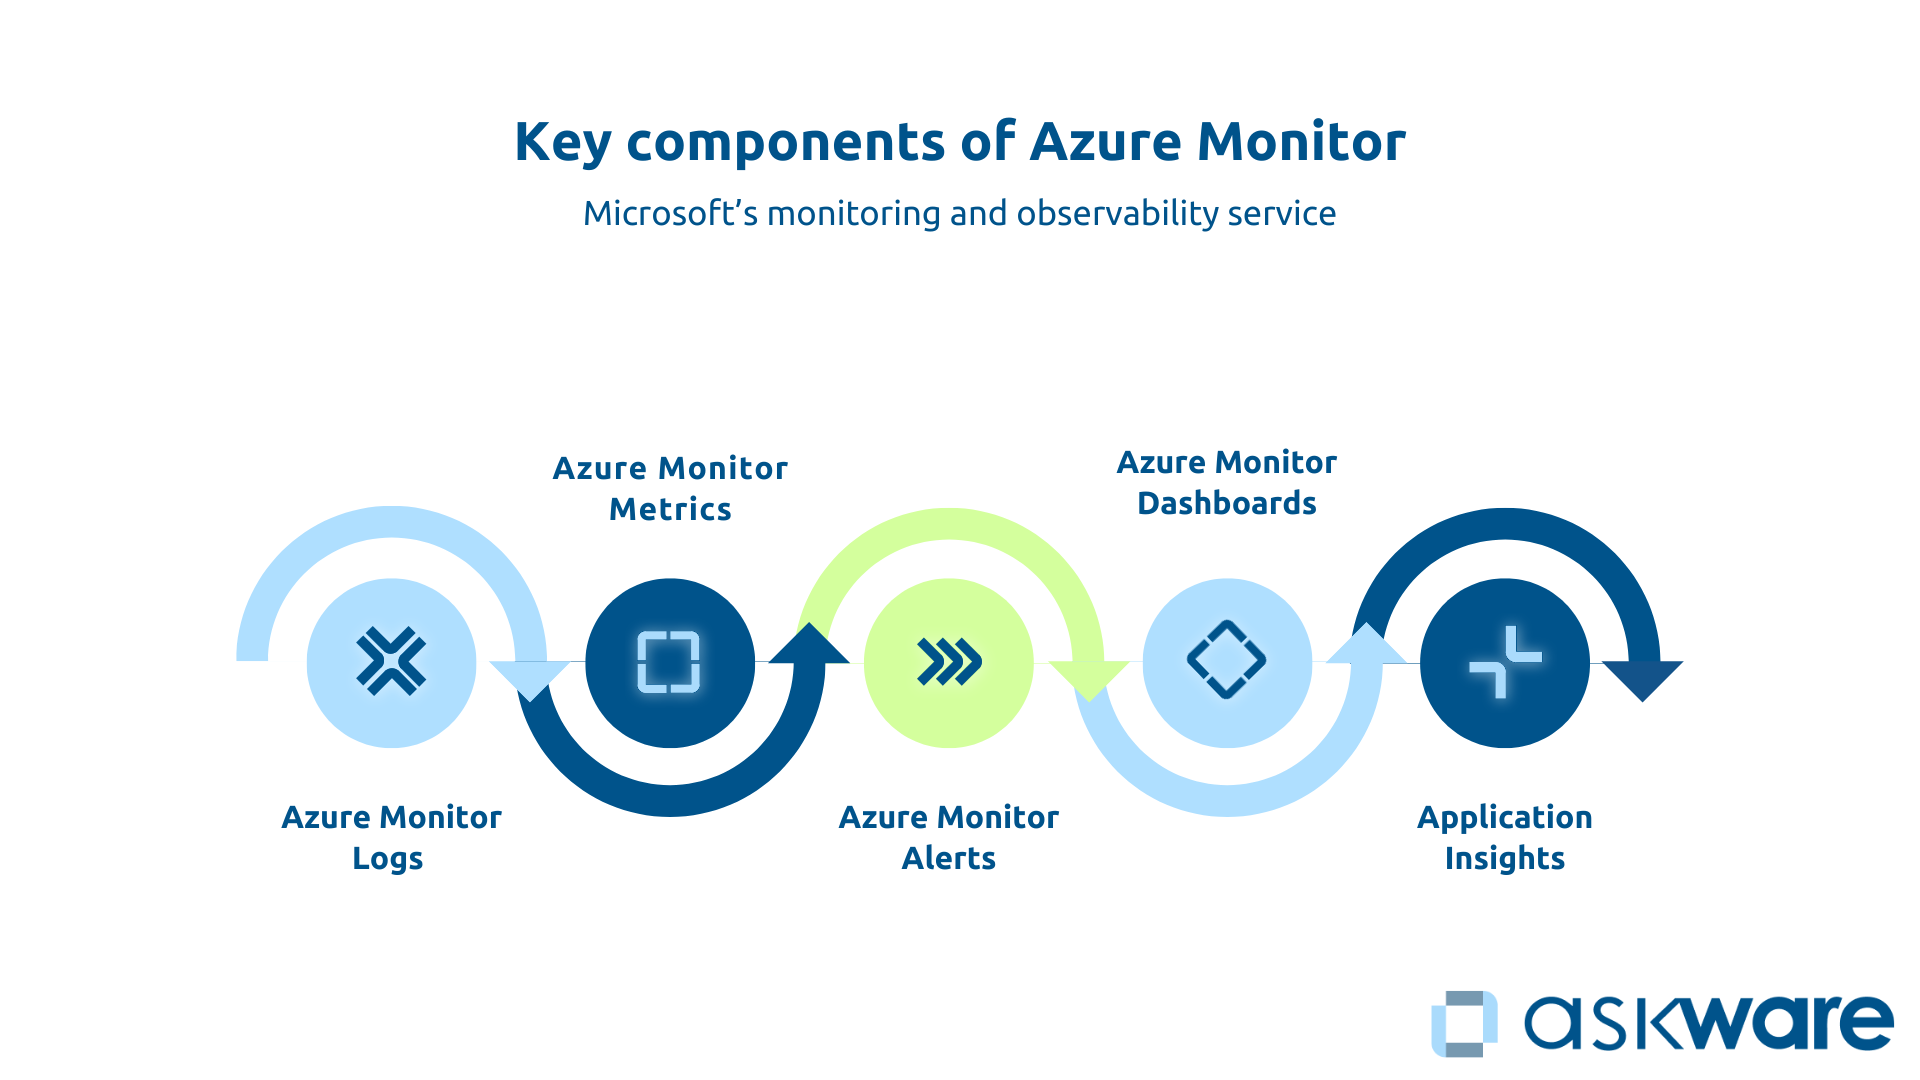
The key components of Azure Monitor
Azure Monitor is based on a modular architecture that combines several complementary components.
Azure Monitor Logs (Log Analytics) centralizes the storage of all your logs in a dedicated workspace. You query these logs with KQL queries to diagnose problems, analyze security, or produce audit reports.
Azure Monitor Metrics collection of numerical metrics in real time: CPU, memory, number of requests, response time. These time series allow you to monitor performance and detect anomalies before they become critical.
Azure Monitor Alerts triggers notifications or automatic actions based on your metrics or logs. An alert can send an email, create a ticket, or even run an automation script to correct the problem.
Azure Monitor Dashboards transform your raw data into understandable visualizations that can be shared with your teams.
Application Insights specializes in application performance monitoring (APM) with AI-based intelligent anomaly detection capabilities.
Monitoring vs Observability: what's the difference?
The Monitoring consists of monitoring predefined metrics and alerting when a threshold is exceeded. You define in advance what you want to monitor as a CPU greater than 85% or a response time above 3 seconds.
It is a preventive approach but limited to what you anticipated.
Observability goes further: it gives you the ability to understand the internal state of your systems from their outputs, even for unforeseen situations. It allows you to explore and ask ad-hoc questions to diagnose the unexpected.
Concretely, if monitoring alerts you if “the CPU is at 85% “, observability will allow you to investigate “why did the CPU rise?” What specific request caused it?”
Azure Monitor combines both: proactive monitoring via alerts and investigative capability via KQL to diagnose.
Overseeing Dynamics 365 with Azure Monitor
Dynamics 365 data sources in Azure Monitor
Dynamics 365 stores its data in Dataverse, which is based on Azure SQL Database. Activity logs, API calls, and data operations logs can be exported to Azure Monitor. To do this, you need to activate the export of Dataverse logs to your Azure Log Analytics workspace in the Power Platform Admin Center.
You select the types of logs to be transmitted:
- Audit logs (for traceability: who does what and when),
- Performance logs (request response time),
- Error logs (API failures, workflow errors),
- API call logs (consumption limits).
By default, not all logs are available. Some advanced Azure telemetry requires specific Dynamics 365 licenses.
Critical metrics to monitor for Dynamics 365
Don't drown yourself in metrics. Focus on the ones that really impact the user experience and the business. Four categories of logs feed into your Dynamics 365 monitoring:
- Performance : The response time of pages and forms is your main indicator. Beyond 3 seconds, users perceive a slowness. Also, monitor the execution time of SQL queries and the loading of dashboards.
- Availability : The uptime of your instance, the API error rate (a rate greater than 1% deserves investigation), and the connection failures indicate the stability of your environment.
- Use : Monitor the number of connected users, the number of API requests against your limits, the volume of data stored, and the number of workflows that were executed. Anticipating when limits are reached prevents service interruptions.
- Integrations health : In the Microsoft ecosystem as elsewhere, sync failures and connector errors reveal problems that can cripple business processes.
Concrete use cases: Dynamics 365 alerts and dashboards
For example, salespeople go back a Alert on slowdowns in Dynamics 365 Sales. You can set up alerts using Azure Monitor on the average response time of Sales forms. If the time exceeds 5 seconds for 5 minutes, an email goes to the IT team to identify the cause: poorly optimized SQL query, connection peak, or infrastructure problem.
It is also possible to be alerted to API limits. Monitor Dataverse API calls and set up a preventive alert at 80% of the daily limit. You thus identify the most consuming processes (often poorly optimized Power Automate flows) before the interruption.
It is also possible to create a Dynamics 365 health dashboard with the number of active users in real time, the response time per module (Sales, Service, Marketing), an error rate graph, the top 5 frequent errors and an API consumption gauge. Your ops team consults it every morning.
Finally, as a final example, Azure Monitor can support you on security audits for GDPR compliance. Thanks to a KQL query, we extract all accesses to the “Contacts” entity by external users. This monthly report documents your compliance and detects possible inappropriate accesses.
Overseeing Power Platform with Azure Monitor
Power Platform data sources in Azure Monitor
Power Platform has its own analytics but integration with Azure Monitor offers unified supervision.
The export is done through custom Power Automate connectors that transmit metrics to Log Analytics or via the Power Platform Management API.
Four categories of logs feed your monitoring:
- App usage logs,
- Power Automate flow execution logs,
- Power BI consumption logs,
- API call logs.
Critical metrics to monitor for Power Platform
On Power Apps : The number of active users per application, the loading time (beyond 10 seconds, the app requires optimization), and the error rate directly impact the user experience.
On Power Automate : The number of flows executed, their success rate versus failure and their average execution time are your essential KPIs. A failure rate greater than 5% indicates a structural problem. Also, monitor your stock consumption against the limits of your plan.
On Power BI : The number of reports viewed, the refresh time of datasets, and refresh failures indicate the health of your decision-making ecosystem.
Service limits of the Power Platform should also be monitored: Daily API calls, the Dataverse storage used, and the number of active Power Apps should be monitored and compared to the plan. Consumption at 80% of the limits triggers a preventive alert.
Concrete use cases: Power Platform alerts and dashboards
For critical business processes that are automated via Power Automate (such as approvals), it is possible to create alerts on failed flows. So if a critical flow fails 3 times in 1 hour, an immediate alert allows you to consult the error logs and correct them quickly to avoid approvals getting stuck or important notifications never leaving.
You can create a Power Apps usage dashboard : with the top 10 most used apps, the number of active users per app, the error rate per app, and apps that haven't been used for 30 days. This dashboard guides your decisions: promote successful apps, optimize those that generate errors, archive those that no longer serve.
You can also monitor the limits : A dashboard shows your daily API consumption versus limit, your Dataverse storage used versus quota, and the top API consumer flows. You anticipate a possible plan upgrade rather than experiencing a sudden blockage.
.png)
Setting up Azure Monitor: where do you start?
Create a Log Analytics Workspace
Workspace Log Analytics is your foundation. It is a centralized storage space for logs. Creating it via the Azure portal only takes a few clicks.
You define the storage region (prioritize the same as your resources) and the data retention period (30 days by default, adjustable according to your compliance needs).
The business model works on a pay-per-GB basis: you pay according to the volume of logs ingested and the retention period.
Two organizational approaches are possible depending on the size of your organization: one workspace per environment (production, preproduction) to isolate data or a centralized workspace to simplify management.
Connect your data sources (Dynamics 365, Power Platform, Azure)
The relevance of Azure Monitor dashboards depends on the quality of the data collected.
For Dynamics 365 and Dataverse : Activate the export of logs from the Power Platform Admin Center by selecting the relevant types (audit, performance, errors).
For Power Platform : Use Power Automate connectors to automatically push metrics to Log Analytics or query the Power Platform Management API. The community shares ready-to-use templates.
Azure : Azure resources integrate natively. Install the Azure Monitor agent on your VMs and enable diagnostic settings on your PaaS services.
Take a gradual approach: start with your critical sources and then expand the scope as you go.
Create your first alerts and dashboards
Just get started. Create a basic alert such as alerting if a VM's CPU exceeds 80%. Define the metric, trigger condition (threshold and duration), action (email), then activate and test.
For your first dashboard, create a basic “Dynamics 365 Health” view with tiles displaying key metrics: active users, average response time, error rates. Share it with your team for feedback.
Kusto Query Language (KQL) is your key to getting the most out of Azure Monitor. Its syntax is similar to SQL. Microsoft Learn offers free, progressive tutorials.
For example, a query to know the number of actions per user over the last hour would be written: AuditLogs | where TimeGenerated > ago (1h) | summarize count () by User.
.png)
Azure monitoring best practices
Define the right metrics and thresholds
It's the classic trap. Too many irrelevant alerts and your teams end up ignoring them all.
Prioritize metrics that really impact user experience Or the Business. Set realistic thresholds based on your history, not arbitrary values. An 80% CPU for 5 minutes that correlates with a deterioration in response time deserves attention, not a 50% CPU.
Each alert must be actionable: it triggers a clear procedure. Regularly review your alerts and thresholds according to the evolution of your environments (seasonality, growth, new functionalities).
Organize dashboards by audience
Different audiences require different views.
- The IT/Ops dashboard displays technical metrics (CPU, memory, response time, error logs).
- The Dashboard Management focuses on business KPIs (active users, availability, usage trends).
- Application dashboards show the specific metrics that are relevant to business teams.
Dashboards should be simple, visual, and immediately understandable.
Automating incident responses
Azure Monitor is not limited to alerts: it can trigger automatic actions in the event of an alert via Azure Action Groups. For example, if a VM's CPU exceeds 90%, scale automatically. If a critical Power Automate flow fails, create a priority support ticket immediately.
Automation drastically reduces MTTR (Mean Time To Repair) by acting before a human is even aware of the problem, freeing up your teams to focus on complex problems.
Azure Monitor isn't just a log collector. It's your unified control tower to oversee the health, performance, and usage of your entire Microsoft ecosystem. You are moving from a reactive to a proactive approach: detecting and resolving before the user impact.
Succeeding with Azure Monitor requires clearly defining your strategy: identifying the metrics that really matter, setting realistic thresholds, creating actionable alerts, and training your teams in KQL. Microsoft provides the tool, but the optimal configuration requires expertise and experience.
Askware supports you to audit your monitoring needs on the Microsoft cloud, configure Azure Monitor specifically for Dynamics 365 and Power Platform, create relevant dashboards and alerts, train your teams, and ensure effective end-to-end monitoring.