Generative AI: what concrete opportunities for business departments?
Generative AI: discover concrete opportunities for marketing, sales, customer support, and HR with Microsoft Copilot. Use cases and ROI.
In a context where customer experience has become as decisive a differentiator as the product itself, companies are accumulating satisfaction metrics. NPS, CSAT, first contact resolution rate... The dashboard is expanding, but clarity doesn't always keep pace.
But then, do your customers easily find what they're looking for when they interact with you? That's where the Customer Effort Score (CES) comes into play.
In this article, we explain what this metric measures, how to calculate it, how it differs from NPS and CSAT, and most importantly, how to implement it effectively within your organization, as part of a unified customer relationship, capable of transforming a score into action.

The Customer Effort Score measures the effort perceived by the customer to :
The typical question asked in a CES questionnaire takes this form: "How easy did you find it to [action]?", on a scale of 1 (very difficult) to 7 (very easy). This phrasing corresponds to CES 2.0, widely used today in customer effort measurement tools.
For example, a customer contacts support for a technical issue. If they have to call three times, send two emails, and wait five days for a response, their CES will be low, indicating high friction. If they get a complete response in a single contact in less than 24 hours, their CES will be high.
Introduced in 2010 in the article Stop Trying to Delight Your Customers, published by Matthew Dixon, Karen Freeman, and Nicholas Toman in the Harvard Business Review, CES has shown that the less effort a customer has to exert, the smoother their experience, and the more likely they are to remain loyal.
Since then, CES collection has evolved significantly, moving from post-interaction paper questionnaires to automated workflows integrated directly into digital customer journeys.
CES is an operational indicator. This means it measures ease of use and journey fluidity. It is particularly relevant in situations where simplicity is a key criterion such as customer support, a complex purchasing process, onboarding, or complaint management.
However, CES does not measure emotional satisfaction (that's the role of CSAT) or the likelihood of recommending the brand (that's NPS's role). Indeed, a customer might be very satisfied with a product's quality while finding the ordering process cumbersome.
This is precisely why CES is not intended to replace other indicators, but rather to reveal what they don't: the concrete frictions in the customer's operational experience.
In summary: NPS tells you if your customers appreciate you, CSAT tells you if they were satisfied with an interaction, and CES tells you if that interaction was easy.
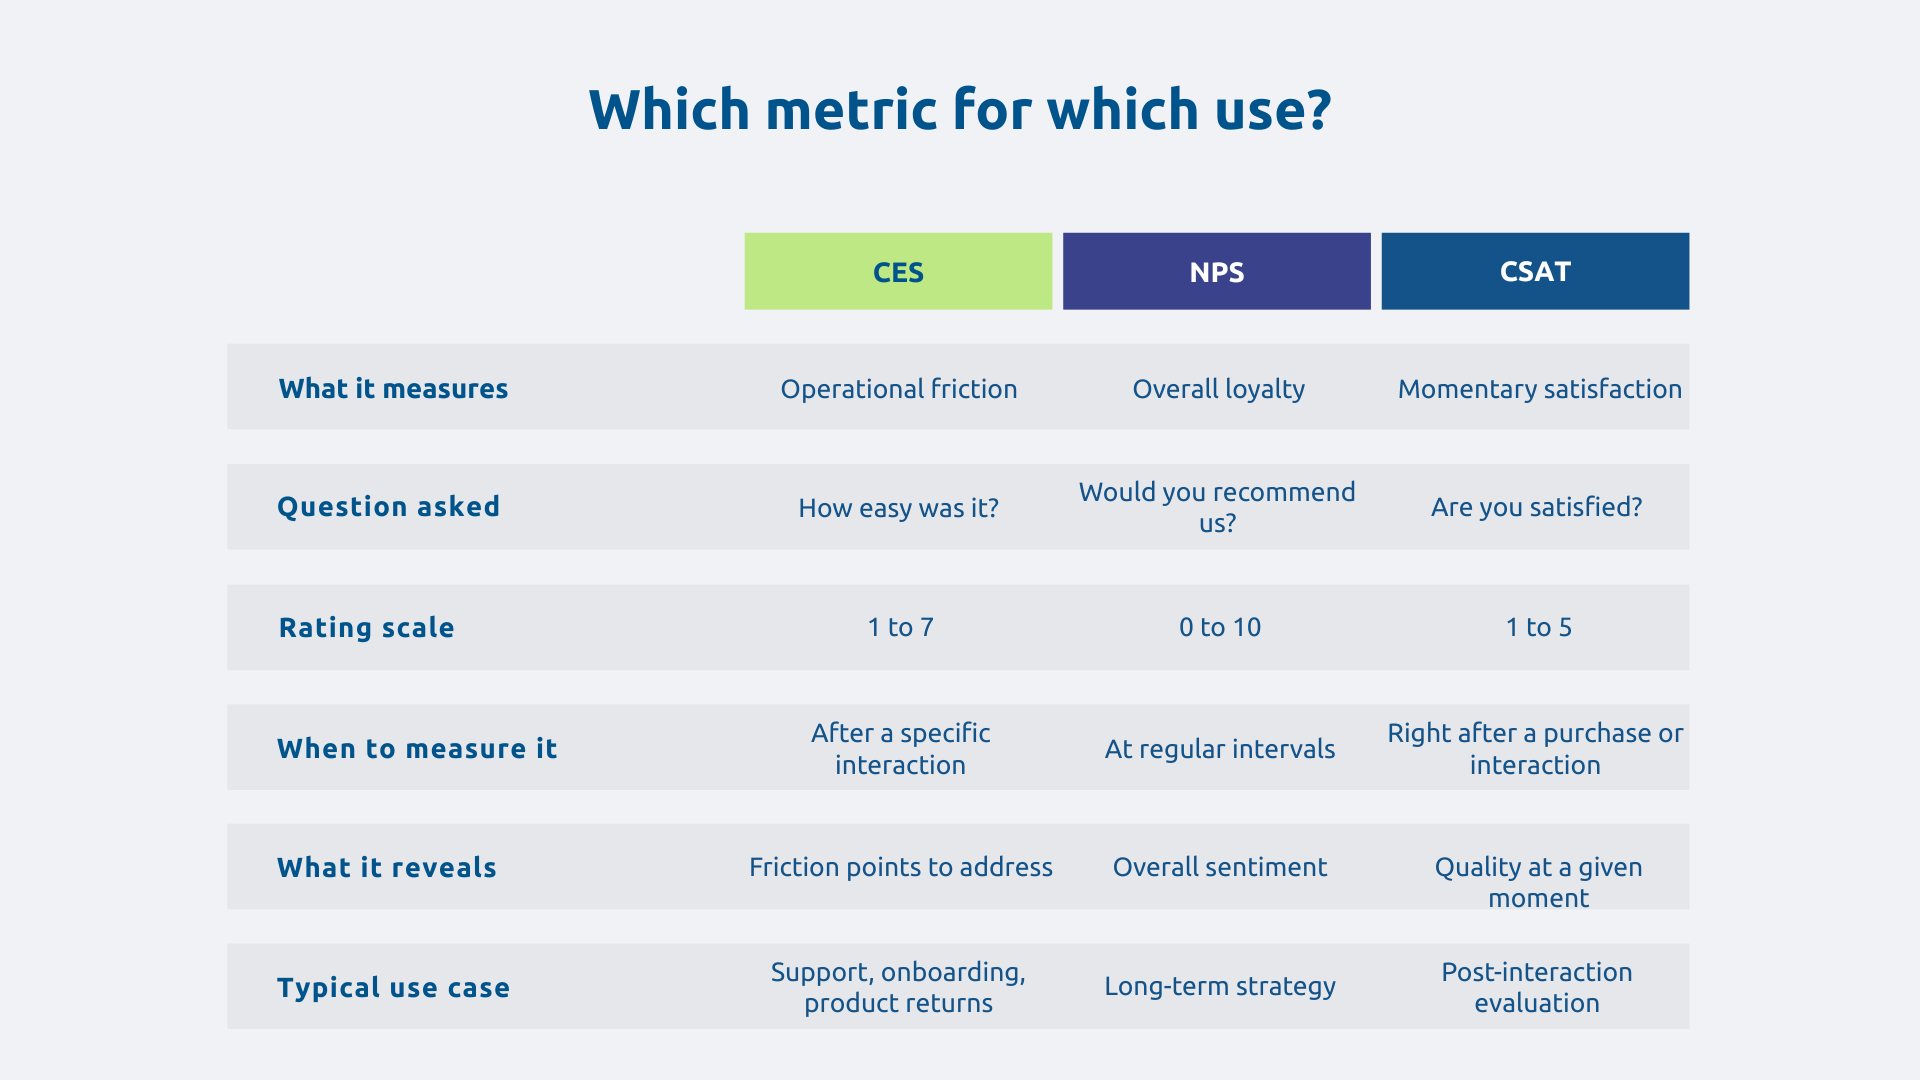
CES excels in situations where repeatability and fluidity are central concerns. Customer support is the most obvious example: each resolved ticket is an opportunity to measure whether the customer had to try multiple times, escalate, or rephrase their request.
It is also very well suited for onboarding processes (SaaS, financial services), e-commerce purchase funnels, and any journey where perceived complexity can be discouraging. For example, a bank that simplifies the submission of a loan application can precisely measure the impact of this simplification via CES, long before NPS reflects the change.
Integrating these three indicators into a single dashboard provides a 360° view of the customer experience: NPS for long-term strategy, CSAT for quick post-interaction adjustments, and CES for continuous process improvement.
But this vision is only valuable if data is collected automatically, centralized in a CRM, and cross-referenced with other information :
This is where the technological dimension comes in, and it's what distinguishes a scalable dashboard, such as those that can be built with a strategy of data visualization solid, from an Excel file manually updated each month.
Two methods exist for calculating CES, depending on usage.
The first is the average CES : sum of all scores divided by the number of respondents.
The second is the Top 2 Box : percentage of customers who responded 6 or 7. This is useful for external comparisons and benchmarking, as it reduces the influence of median scores.
Numerical example: out of 100 respondents, 40 rated 7, 30 rated 6, 20 rated 5, and 10 rated 4. The average CES is 6.0; the Top 2 Box is 70%.
That said, the real challenge is not so much the formula as the collection systematic on the right contact points.
The relevance of CES depends as much on timing as on content. The question should be asked immediately after the interaction in question, before the memory fades or gets mixed with other experiences.
Thus, the key moments are as follows:
Note that channels may vary (automated email, integrated pop-up, post-interaction SMS, in-app notification) depending on the context.
To illustrate: an e-commerce merchant schedules an automatic email to be sent a few hours after delivery, containing a single CES question and a one-click response link. Simple, fast, non-intrusive.
Some practitioners consider an average CES score above 5/7 to be a satisfactory level, but benchmarks vary greatly depending on sectors and methodologies.
What matters more than the absolute score is the trend analysis over time, the segmentation by interaction type or by customer profile and identifying recurring pain points.
A stable average CES can mask a deterioration in a specific segment. Therefore, cross-referencing CES with qualitative verbatims is essential to understand the "why" behind the numbers.
Indeed, a low score on the product return process doesn't yet tell you what the problem is. Is it the form, the refund period, the communication? Open-ended comments complement the objective data.
Before deploying questionnaires, you will need to map your customer journeys and identify moments of high friction or high retention stakes.
Don't try to measure everything because it's counterproductive. Three well-chosen and fully utilized measurement points are better than ten questions scattered across every interaction, whose results accumulate without ever being analyzed.
As an indication, for a SaaS company, priorities will likely be onboarding, first-level technical support, and major updates. For an e-commerce player, it will be more about the checkout process, delivery, and the return process. Finally, for a banking institution, the focus will be on administrative procedures and complaint management.
In any case, keep in mind that CES is only truly meaningful where fluidity directly impacts customer loyalty.
Automation ensures the systematic nature of data collection. Each relevant interaction automatically triggers a questionnaire and allows for real-time analysis without manual intervention.
Within the Microsoft ecosystem, the combination Dynamics 365 Customer Service + Power Automate + Power Apps offers a comprehensive architecture. A typical workflow example: a customer closes a ticket in Dynamics 365; Power Automate automatically sends an email with the CES question; responses can then be integrated into Dynamics 365 according to the configured setup; the Power BI dashboard updates in real-time.

This integration avoids manual entry, eliminates delays, and centralizes data where it has value, namely alongside other customer information. Without automation, CES remains anecdotal data. With it, it becomes a management tool.
Centralized within the CRM alongside purchase history, past interactions, and customer segment, CES integrates into a Customer Data Platform, where each signal contributes to enriching customer knowledge.
As a result, several concrete uses emerge:
For example: a declining CES for the return process can automatically trigger an alert to the relevant teams, leading to an in-depth analysis of the journey and, if necessary, a revision of the logistics process or targeted training for support teams. Without this feedback loop, the data lies dormant.
In summary, the Customer Effort Score is a powerful operational indicator precisely because it is actionable. While NPS reflects an overall sentiment and CSAT captures momentary satisfaction, CES identifies concrete friction points — and therefore, priority areas for improvement.
Its effectiveness relies on automated collection at the right time, data centralization in a unified system, and the ability to transform insights into concrete decisions. In an isolated spreadsheet, CES loses most of its value, but when integrated into a coherent CRM ecosystem (Dynamics 365, Power Platform, Power BI), it becomes a powerful daily management tool.
In a context where every interaction counts, every eliminated friction point is a step towards greater loyalty. Askware supports companies in the deployment and leveraging of CES within the Microsoft ecosystem. If you want to transform this metric into a performance tool, contact our experts.
We start by analyzing the lowest scores, cross-referencing them with verbatim feedback to identify the root causes. Then, we make iterative corrections, meaning each wave of improvements is validated by the subsequent CES wave.
NPS evaluates the overall relationship and is driven at the long-term strategic level, whereas CES targets a specific moment in the journey and guides immediate operational decisions. The two are complementary, not redundant.
CES is the go-to metric whenever ease of experience is the central concern: high-volume repetitive processes (support, customer service, onboarding), complex purchase funnels, or any journey where avoidable friction risks fueling churn.
Our experts share their vision of best practices and technological trends to ensure the success of your digital transformation.